CyberWISER Essential Service Components
CyberWISER Essential Dashboard is divided up in different sections, calling on different widgets to persent the user data from the Data Warehouse and other WISER Provider layer components. The sections are accessed via the Dashboard top menu
 Risk Reporting Configuration Monitoring RModelling DSS Testing Risk Reporting Configuration Monitoring RModelling DSS Testing
|
The Risk Reporting section contains information allowing following in real-time the cyber risk assessment of the company. Using specific widgets it provides data on
- Qualitative Risk Status – overall qualitative risk status of the client (with detailed view on the Risk Patterns in the selected models).
- Quantitative Risk Status – overall quantitative risk status of the client.
- Qualitative Risk Status History – qualitative historical view on the risk status of the targets.
- Quantitative Risk Status History – historical view on the risk statuses of the targets assessed by corresponding assessed value risking due to the risk status.
- Selected Risk Models – pre-configured models that were chosen for the client.
- A graph showing the evolution of the qualitative risk status over the time.
- A bars graph showing how many risks are assessed at the different risk levels considered.
- A bars graph showing the current risk level in comparison to an average which can be calculated for a timeframe selected by the user.
- A bars graph showing the assessed risk per model used.
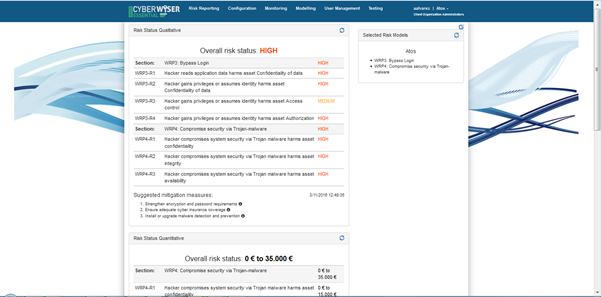
The ‘WISER Risk Status Qualitative’ widget serves to indicate in real time the risk status of the company. On top of the on-line report, it is shown the overall risk status which can be very low, low, medium, high and very high.
This is broken down into sections coin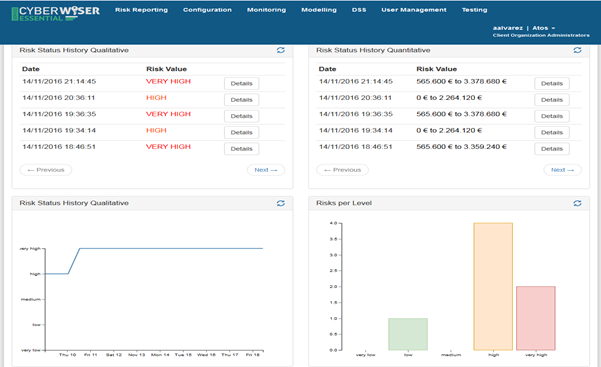 ciding with the risk models selected by the user. The figure shows the particular case when two different risk models have been selected. Each risk model is later broken down into individual risks and, in turn, such risks are evaluated considering the different targets for which the risk in question is evaluated.
The history of qualitative risk evaluation is also presented in a graphical way in the ‘Risk Status History Qualitative’ widget. The curve shows overall risk status values for the last ten days.
The number of risks being at the different risk levels can be seen with a bar chart offered in the widget ‘Risks per level’. The widget entitled ‘Risk status average’ shows the current overall risk in comparison to the historic average calculated for a timeframe selected by the user. Also, the risk level obtained per model is shown in the widget entitled ‘Risks per Model’.
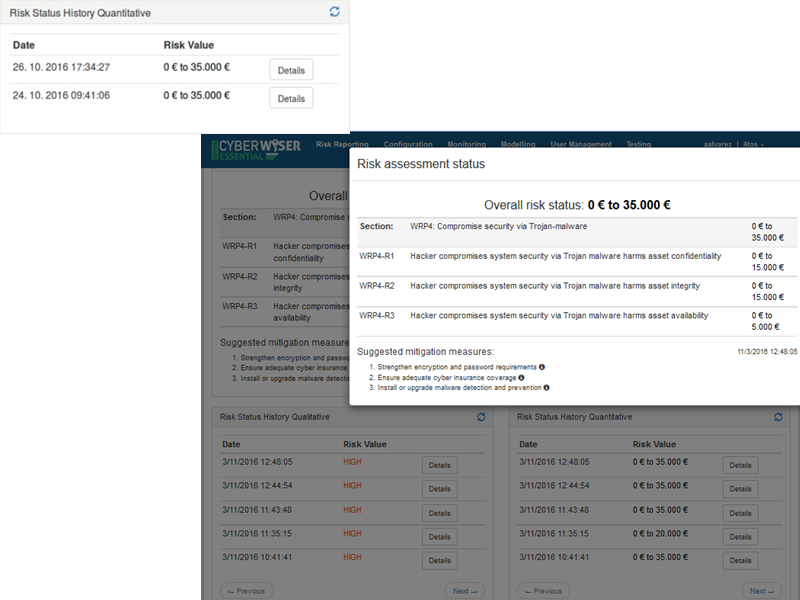
The risk report can also be offered in quantitative terms, i.e., expressed in amounts of money. This is the role of the widget entitled ‘WISER Risk Status Quantitative’. R models, on which this evaluation is based, express the risk in intervals, but this information will be given as a distribution, as well.
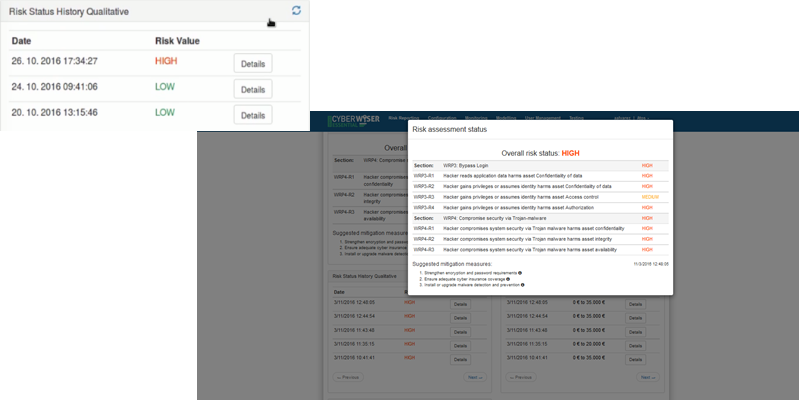
The dashboard offers the chance to follow the evolution of both the qualitative and the quantitative reports. In order to do that, specific widgets are made available. The widget named ‘Risk Status History Qualitative’ registers each qualitative report that has been issued. It indicates the date and time when the report was issued and the overall risk value that was obtained by the evaluation algorithms. For each report, it is possible to access the breakdown of the report in question by clicking the button ‘Details’.
Users are also provided the detail of the quantitative risk status history. In the same way the qualitative version does, by clicking on the ‘Details’ button, it is possible to obtain a detail of a specific quantitative report report.
The configuration section is composed of three widgets: the widget used to select the risk model to be used, the widget where the targets are configured (including creation, edition and deletion), and finally the questionnaire that the user has to answer in order to provide the business configuration information to the framework.
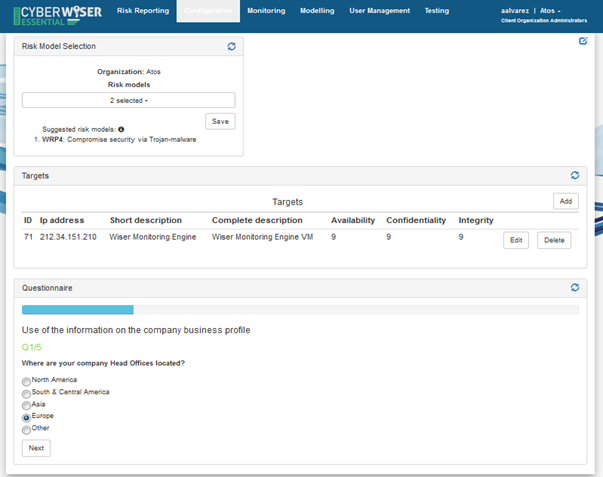 The risk model selection widget contains a combo menu where one or more models can be selected. Once the selection is done, the button ’Save’ serves to keep such selection until a new modification takes place. CyberWISER-Essential (like CyberWISER-Plus) suggests risk models. To do this, it matches the relevance criteria associated to the models existing in the library to the key characteristics of the targets composing the infrastructure.
The widget entitled ‘Targets’ is envisioned to define and configure the targets composing the client infrastructure. Each target is characterized by the following parameters:
Id: a sequence number
IP address of the target
Short description of the target
Complete description of the target
Availability: refers to the availability of the target. It is assessed by giving a score from 0 to 10, where 10 means that the machine is indispensable for the company´s workflows, i.e., critical to have 100% uptime.
Confidentiality: refers to the confidentiality of the information contained in the target in question. It is assessed by giving a score from 0 to 10 where 10 means that the machine contains highly sensitive information that can be seen only by authorised users.
Integrity: refers to the integrity of the information present on the target machine. It is assessed by giving a score from 0 to 10 where 10 means that the machine has information that cannot be in any way compromised.
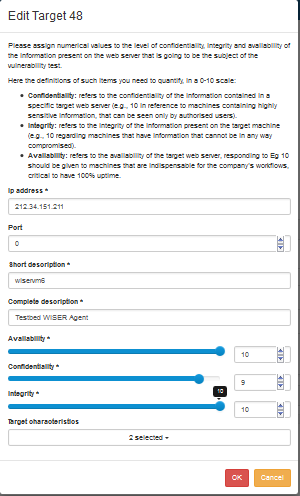
Once created, the target can be edited or deleted. By clicking on the ‘Add’ button a new target can be added to the list of targets included in the widget.
A dialog box is open where the different chapters are to be filled. It is worthwhile to remark the combo menu appearing just at the end of the dialog box, where the user can associate one or more characteristics to a specific target.
Likewise, the target can be edited later on if some information needs to be changed. To do that, the ‘Edit’ button has to be clicked and the corresponding dialog box will pop up.
The monitoring section is composed of three widgets:
- The sensor status, where a heartbeat mechanism allows the user to know when the sensor last sent some feedback and determine whether it is alive or not
- The event look-up, which is the list of events produced by the monitoring infrastructure
- The alarms look-up, which is the list of alarms obtained out of such events, by means of filtering and correlation rules
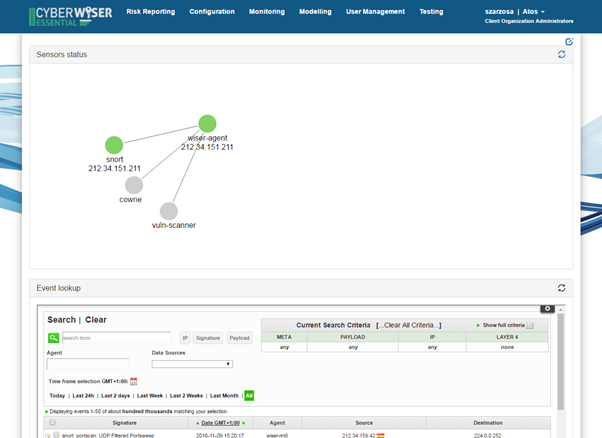
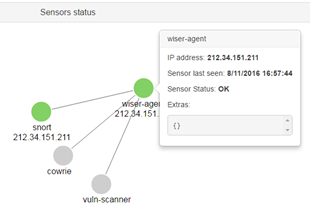
The ‘sensors status’ widget, this indicates which sensors have recently sent information and which ones have not. This is a way to ascertain if a sensor is ‘alive’. There is a colour code to indicate the status of the sensors: red to indicate that it has not sent any feedback for a long time, green to indicate that the sensor recently sent feedback and grey to indicate that there is no information available concerning the sensor. By clicking on each circle, status details are shown.
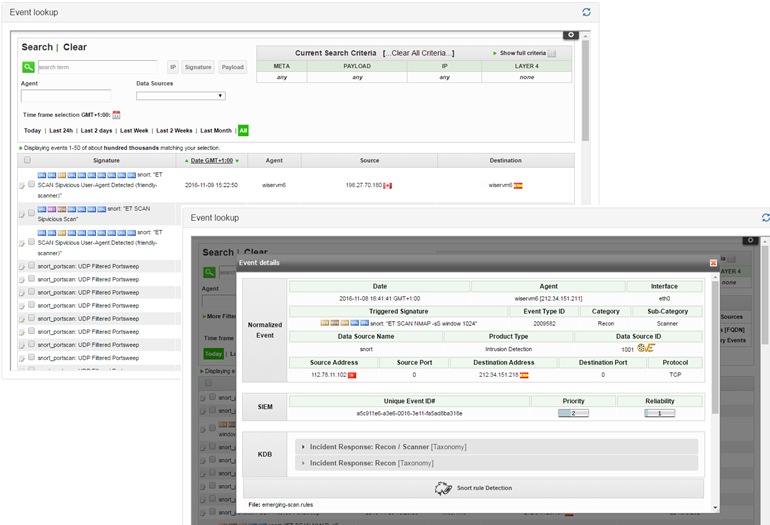 The ‘event lookup’ widget (Figure 54) shows the events generated by the monitoring infrastructure. It shows a table where each row represents one event having been generated. For each event, the following information is shown: 1) Signature/name of the event; 2) Date and time; 3) WISER Agent from which it comes; 4) Source IP and 5) Destination IP. The country to which the IP address belongs is shown.
The widget offers some searching criteria in order to filter what is really important for the user. By default, all the events received are shown and filters can be applied based on different timeframes (Today, Last 24h, Last 2 days, Last Week, Last 2 Weeks, Last Month or All). Besides, the user can specify the WISER agent where the events were collected, for example in case there are several agents deployed in the monitored infrastructure, or filter by a specific data source . The current search criteria are also shown in the right side of the search box and the user can clear all or part of the criteria directly on the dashboard.
Other filters available are by source or destination IP address, by the signature (name) of the event or searching a term in the Payload. With these searching criteria or in case the data source or sensor is not found, an additional Meta Criteria box in the right side where the user can select them in an easy way.
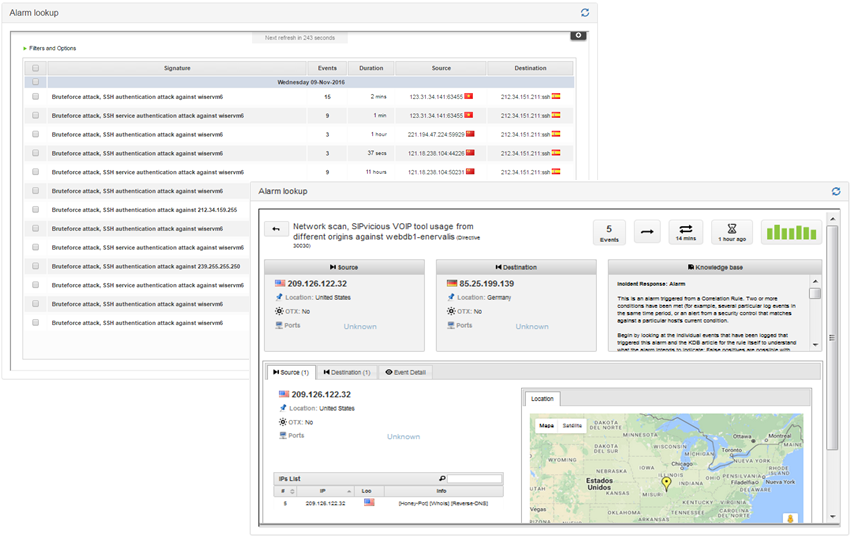 The Alarm look-up widget comes into place when the events are processed they may result in alarms, which are relevant information giving valuable insights about facts that need immediate reaction from the organisation side. This widget is reporting several alarms having to do with various SSH authentication attacks happening against an identified objective and coming from several ports of a specific attacker machine.
 © Copyright 2021 - CYBERWISER.eu has received funding from the European Union’s Horizon 2020 research and innovation programme under the Grant Agreement no. 786668. The content of this website does not represent the opinion of the European Union, and the European Union is not responsible for any use that might be made of such content.